

Russian officials have lost their optimism and are now openly acknowledging that a recession is looming. While official statistics still paint a picture of economic growth, independent experts and business insiders point to a far bleaker reality. In fact, the economic slump that began with the start of the full-scale war never actually ended. As alternative inflation indicators like the so-called “Okroshka Index” prove unreliable, the only credible independent data from the Romir research holding has suddenly stopped being published — and even when this data was still available, it showed that real inflation in recent years was significantly higher than the official figures suggested. This means Russia wasn’t prospering — it was living on borrowed time. Now the reckoning is approaching, though the government prefers to call it a “soft landing.”
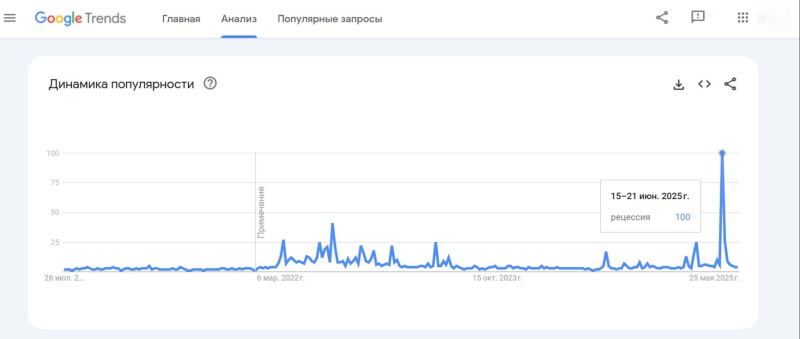
Many respected economists have already stated that a recession is threatening Russia. But what truly grabbed the public’s attention was the heated discussion at the St. Petersburg International Economic Forum. After the event, searches for the term “recession” surged by a factor of 100. Even at the height of public anxiety in 2022, interest in the term was barely a third of what it was in late June, when Economic Development Minister Maksim Reshetnikov remarked: “Judging by current business sentiment, it seems we’re already on the verge of slipping into a recession.”
Money supply, or monetary aggregate M2, is the sum of cash in circulation outside the banking system plus the money available to holders of bank accounts.
Nominal GDP: in the first year 1000*1+100*10=1000+1000=2000, in the second year 1000*1.2+105*10=1200+1050=2250. That is, an increase of 250 tugriks or 12.5%.
To use the deflator, it is necessary to determine the specific weights of all goods. The share of bread loaves is 1200 out of 2250, that is, 53.3%. The share of televisions is 1050 out of 2250, that is, 46.7%.
Taking these weights into account, bread loaf production did not grow, while television production grew by 5%. Therefore, the weighted average production growth will equal the product of 0.05 and 0.467, that is, 2.335%.
1,1*1,15*1,03*1,12=1,46
For 2024, GDP amounted to 201 trillion against 108 trillion in 2020, that is, it grew by a factor of 1.86, not exactly by a factor of two.
Both Reshetnikov and Andrei Makarov, the moderator of the macroeconomic panel and a State Duma deputy, effectively acknowledged the failure of current policy. The anti-inflationary measures spearheaded by Central Bank head Elvira Nabiullina have sparked discontent and protest within the government. Still, all participants in the debate continue to sugarcoat the situation: in reality, inflation is much higher than official figures suggest, and real income dynamics are worse.
Curiously, the latest official forecasts from the Ministry of Economic Development for 2025 make no mention of any recession. Under the baseline scenario, GDP is expected to grow by 2.5%. Even in the conservative (read: pessimistic) scenario, growth is projected at 1.8%. And that's assuming the Central Bank doesn’t ease its monetary policy. The possibility of prolonged high interest rates has already been factored into Reshetnikov’s forecast, and yet the ministry envisions a mere slowdown in growth, not a recession.
In fact, 1.8% growth wouldn’t be bad at all for Russia. The country’s average annual growth from 2013 to 2021 was just 1.23%, and even that figure would outpace IMF expectations for the UK (1.1%), France (0.6%), Italy (0.4%), Germany (0%), Japan (0.6%), and Canada (1.4%). At that rate, Russia would be increasing its economic weight compared to the bloc of so-called “unfriendly nations.” So where does all this pessimism in Reshetnikov’s remarks come from?
Money supply, or monetary aggregate M2, is the sum of cash in circulation outside the banking system plus the money available to holders of bank accounts.
Nominal GDP: in the first year 1000*1+100*10=1000+1000=2000, in the second year 1000*1.2+105*10=1200+1050=2250. That is, an increase of 250 tugriks or 12.5%.
To use the deflator, it is necessary to determine the specific weights of all goods. The share of bread loaves is 1200 out of 2250, that is, 53.3%. The share of televisions is 1050 out of 2250, that is, 46.7%.
Taking these weights into account, bread loaf production did not grow, while television production grew by 5%. Therefore, the weighted average production growth will equal the product of 0.05 and 0.467, that is, 2.335%.
1,1*1,15*1,03*1,12=1,46
For 2024, GDP amounted to 201 trillion against 108 trillion in 2020, that is, it grew by a factor of 1.86, not exactly by a factor of two.
The “conservative” scenario from the Economic Development Ministry projects Russia’s GDP to grow by 1.8% — outpacing the UK, France, Germany, and Canada
It’s reasonable to assume that the minister is aware that Russia’s official GDP figures are enhanced by statistical manipulation. In a situation where the structure of the economy is shifting rapidly, prices for most goods are rising just as fast, even if measuring it accurately has proven difficult. In estimates, every product category includes a variety of brands with wide price ranges, and even the same brand can vary sharply in price between neighboring stores.
And the fight against inflation might be winding down. The Central Bank of Russia has cut the key interest rate by three percentage points in the past two months, signalling at least a partial shift back towards stimulating economic growth. In simpler terms, the Central Bank, too, appears to fear a recession. The current rate of 18% is identical to the one that prevailed from July-September 2024 — and back then, it failed to rein in inflation. In effect, the aggressive attempt to crush price growth through a high interest rate appears to be over.
Over the past six months, monetary policy has indeed been tighter than at any time since the war began. From January to July 2025, the money supply (more precisely, the M2 monetary aggregate) grew by just 1.6% – compared to 5–6% during the same period in 2022–2024. But this austerity didn’t last long. Today, the money supply is 15% higher than it was a year ago. The inflationary impact of previous monetary expansion will not be offset in half a year.
Another doubling of GDP of the sort that was once held up as a major policy goal has come and gone almost unnoticed. (Granted, the original idea implied real growth, not nominal.) “In 2024, our GDP for the first time exceeded 200 trillion rubles in nominal terms, nearly doubling from the 2020 level,” Prime Minister Mikhail Mishustin told lawmakers, trying to sound upbeat. But there’s little to celebrate: in the hyperinflationary chaos of 1992–1993, nominal GDP doubled every four months — if not faster.
Nominal GDP growth includes both real growth and inflation, and the two must be separated if the true picture is to be assessed. In the Russian case, inflation appears to be the primary driver: from the end of 2020 through the end of 2024, the money supply doubled from 58.7 trillion to 117.3 trillion rubles.
So what is the real inflation rate in Russia? Rosstat publishes two main indicators: the Consumer Price Index (CPI) and the GDP deflator. The CPI is relatively straightforward: it tracks the price of a fixed basket of goods over time, typically measured monthly. The composition of this basket is publicly known and rarely changes.
The GDP deflator, on the other hand, is more complex. Here, the “basket” comprises the entire gross domestic product, whose structure varies from year to year. The weight of each item is based on its most recent share in GDP. This method is highly labor-intensive and can only be carried out by a state statistical agency. In Russia, the deflator is calculated quarterly, published with a delay compared to the CPI, and frequently revised later.
It’s no surprise, then, that these different methods produce different results.
Let’s say that in the first year the economy produced 1,000 loaves of bread and 100 televisions, and in the second year it again produced 1,000 loaves but 105 televisions. Previously, bread sold for 1 tugrik and now costs 1.2, while televisions remained at 10 tugriks. This means that the weighted average increase in output would be 2.335%, while the weighted average price increase would be 10.66%. But if we used a basket based on the first year, where both goods had a 50% weight, the production growth would appear higher: 2.5%, with inflation at10%. Such discrepancies are inevitable whenever the structure of output changes — which is to say: always.
In Russian macroeconomic statistics, the inflation rate based on the CPI and the real growth rate based on the GDP deflator receive the most attention. However, Rosstat also measures inflation using the GDP deflator, and it is likewise possible to estimate real growth based on the CPI.
A dramatic divergence between these methods emerged in the data for 2021 and 2022. In 2022, Russia’s nominal GDP rose from 135 trillion to 157 trillion rubles — a 16% increase. That rise was largely driven by price growth, but how much exactly was simply inflation?
For 2022, inflation measured by the Consumer Price Index stood at 12.2%, while the GDP deflator showed 18.1%. Depending on which measure is used, real GDP either shrank by 1.4% (based on the deflator) or grew by 3.8% (based on the CPI).
Why such a discrepancy? The CPI includes the prices of imported consumer goods but excludes investment and non-consumer goods. The GDP deflator, by contrast, covers the entire spectrum of goods and services produced domestically. Moreover, as the earlier bread-and-television example illustrates, the deflator tends to overstate the weight of expanding sectors of the economy (regardless of whether they grow through output or price increases), while the CPI underrepresents them, relying on an outdated consumption basket.
So, if in 2022 the deflator showed significantly higher inflation than the CPI, the likely explanations are:
- Investment goods became more expensive faster than consumer goods (notably, crude oil prices were high that year);
- Prices for domestically produced goods rose faster than prices for imports;
- Prices grew more sharply in relatively strong sectors of the economy (agriculture, construction, finance) than in weaker ones (retail, manufacturing, transport).
Economists skeptical of Rosstat’s methods often turn to alternative price indexes, which offer a different lens on real output dynamics. One of the better-known examples is the “Okroshka Index” — a calculation of how much it costs to make a pot (or four bowls) of the traditional cold soup. The index is published annually by the analytical group Chek Index and is frequently cited not only by pro-government media outlets like Komsomolskaya Pravda, Argumenty i Fakty, and Moskovsky Komsomolets, but also by regional branches of the Bank of Russia.
Here’s what goes into the Chek Index recipe: 300 grams of radishes, 400 grams of potatoes, 5 eggs, 300 grams of cucumbers, 300 grams of boiled sausage, 100 grams of sour cream, 1 liter of kvass, plus one bunch each of green onions and dill. Prices are drawn from online cash register data (via a fiscal data operator) and averaged across product categories. In 2025, the index was up 14% year-over-year as of the second half of April. Still, that’s not the highest jump recorded during the full-scale war: the largest was in spring 2022, when the index rose by 15%.
Money supply, or monetary aggregate M2, is the sum of cash in circulation outside the banking system plus the money available to holders of bank accounts.
Nominal GDP: in the first year 1000*1+100*10=1000+1000=2000, in the second year 1000*1.2+105*10=1200+1050=2250. That is, an increase of 250 tugriks or 12.5%.
To use the deflator, it is necessary to determine the specific weights of all goods. The share of bread loaves is 1200 out of 2250, that is, 53.3%. The share of televisions is 1050 out of 2250, that is, 46.7%.
Taking these weights into account, bread loaf production did not grow, while television production grew by 5%. Therefore, the weighted average production growth will equal the product of 0.05 and 0.467, that is, 2.335%.
1,1*1,15*1,03*1,12=1,46
For 2024, GDP amounted to 201 trillion against 108 trillion in 2020, that is, it grew by a factor of 1.86, not exactly by a factor of two.

If we multiply the annual increases in the Okroshka Index over the 2020–2024 period, we get a cumulative price growth of 46% over four years. And considering that Prime Minister Mikhail Mishustin rounded his numbers up, this would imply that real GDP grew by 28% during that time. That’s an average of 6.3% per year — not bad at all, although this growth was largely driven by the recovery from the sharp contraction of 2020 caused by the COVID-19 pandemic.
But what happens if we try to separate the inflationary and real components of growth — not by using the Consumer Price Index or the GDP deflator, but the Okroshka Index? In 2024, the ingredients for okroshka became more expensive faster than most other goods. In 2021–2022, they outpaced general consumer goods but lagged behind capital goods. In 2023, the prices of okroshka ingredients barely rose at all.
In short, if we believe the Okroshka Index is more accurate than official inflation statistics, we must also accept that the war with Ukraine had no negative impact on the Russian economy — not even in 2022. In short, skeptics of Rosstat’s “polished” data end up with an even more embellished picture when they attempt to start measuring everything in okroshka.
Money supply, or monetary aggregate M2, is the sum of cash in circulation outside the banking system plus the money available to holders of bank accounts.
Nominal GDP: in the first year 1000*1+100*10=1000+1000=2000, in the second year 1000*1.2+105*10=1200+1050=2250. That is, an increase of 250 tugriks or 12.5%.
To use the deflator, it is necessary to determine the specific weights of all goods. The share of bread loaves is 1200 out of 2250, that is, 53.3%. The share of televisions is 1050 out of 2250, that is, 46.7%.
Taking these weights into account, bread loaf production did not grow, while television production grew by 5%. Therefore, the weighted average production growth will equal the product of 0.05 and 0.467, that is, 2.335%.
1,1*1,15*1,03*1,12=1,46
For 2024, GDP amounted to 201 trillion against 108 trillion in 2020, that is, it grew by a factor of 1.86, not exactly by a factor of two.
If we believe the Okroshka Index is more accurate than official inflation data, then we must also believe the war didn’t cause any recession in the Russian economy at all
Perhaps the odd results stem from the general volatility of the vegetable and agricultural markets. Maybe there’s an alternative for capturing inflation trends that is more accurate than the Okroshka Index. Consider, for example, the price of a ride on the Moscow Metro.
In 2021, metro fares rose by 9.5% — roughly in line with the Okroshka Index, higher than the CPI, but lower than the GDP deflator. In 2022, fares increased just 8.7%, below all other measures. In 2023, the hike was 8%, matching the GDP deflator and exceeding both CPI growth and the Okroshka Index. Finally, in 2024, the fare surged by 16.7% — the highest jump of the period.
If we align these figures with nominal GDP growth, we get the following estimates for real GDP: 13.7% growth in 2021, 6.8% in 2022, 3.8% in 2023, and just 1.3% in 2024. According to this method, there was no recession in the Russian economy — not in 2022, and not in subsequent years either.
But should such alternative estimates be considered more reliable than official ones based on the CPI or GDP deflator? No. Any index constructed from a small number of elements is prone to bias and distortion, especially when those elements are relatively homogeneous — like food products are.
And yet, there were some compelling independent estimates of inflation in Russia — at least until very recently. These came from the analytical holding Romir. Like Chek Index, Romir collected retail receipts and calculated average prices for a wide range of goods on a monthly basis. The indicator it published, known as the FMCG Deflator Index, became the most widely cited alternative measure of inflation. However, Romir last released this index in October 2024. The continuous dataset, compiled since at least 2020, is no longer available to the public, and there have been no official statements from Romir or other relevant authorities explaining the sudden disappearance.
Money supply, or monetary aggregate M2, is the sum of cash in circulation outside the banking system plus the money available to holders of bank accounts.
Nominal GDP: in the first year 1000*1+100*10=1000+1000=2000, in the second year 1000*1.2+105*10=1200+1050=2250. That is, an increase of 250 tugriks or 12.5%.
To use the deflator, it is necessary to determine the specific weights of all goods. The share of bread loaves is 1200 out of 2250, that is, 53.3%. The share of televisions is 1050 out of 2250, that is, 46.7%.
Taking these weights into account, bread loaf production did not grow, while television production grew by 5%. Therefore, the weighted average production growth will equal the product of 0.05 and 0.467, that is, 2.335%.
1,1*1,15*1,03*1,12=1,46
For 2024, GDP amounted to 201 trillion against 108 trillion in 2020, that is, it grew by a factor of 1.86, not exactly by a factor of two.
Romir collected store receipts and calculated average prices monthly — until it abruptly stopped in October 2024
Romir’s data release came to a sudden halt shortly after it was cited in the report “Russia’s Economy in the Fog of War,” published by the Stockholm Institute of Transition Economics. Referencing Romir’s numbers, the Swedish researchers suggested that actual inflation in Russia may be significantly higher — and real GDP growth much lower — than official statistics indicate. At the time, Rosstat estimated economic growth for 2023 at 3.6%, while using Romir’s inflation figures would imply a contraction of 8.7%. The methodology behind that calculation is hard to reconstruct, but anyone with access to Romir’s deflators and nominal GDP data could at least make a rough estimate of quarterly real economic trends.
Since 2021, Romir’s deflator has consistently shown much higher price growth than official figures. In September 2024, the firm recorded a 22.1% year-on-year increase in prices for everyday consumer goods — compared to the 10% reported by Rosstat. For comparison, in 2020 Romir registered a 2.5% drop in prices relative to the previous year, while Rosstat claimed a 3.7% increase.
Money supply, or monetary aggregate M2, is the sum of cash in circulation outside the banking system plus the money available to holders of bank accounts.
Nominal GDP: in the first year 1000*1+100*10=1000+1000=2000, in the second year 1000*1.2+105*10=1200+1050=2250. That is, an increase of 250 tugriks or 12.5%.
To use the deflator, it is necessary to determine the specific weights of all goods. The share of bread loaves is 1200 out of 2250, that is, 53.3%. The share of televisions is 1050 out of 2250, that is, 46.7%.
Taking these weights into account, bread loaf production did not grow, while television production grew by 5%. Therefore, the weighted average production growth will equal the product of 0.05 and 0.467, that is, 2.335%.
1,1*1,15*1,03*1,12=1,46
For 2024, GDP amounted to 201 trillion against 108 trillion in 2020, that is, it grew by a factor of 1.86, not exactly by a factor of two.
Interestingly, until the first quarter of 2022, the gap between the two deflators rarely exceeded 5 percentage points, and at times Romir even showed lower inflation than the official numbers. But since the onset of the full-scale war, the divergence has grown significantly. It's possible that after September 2024, Romir might have moved back to within range of Rosstat’s reports. The public, however, never got the chance to find out.
Based on the available data, it can be estimated that Russia’s economy contracted by 19% in 2022, shrank by another 1% in 2023, and was on pace for an additional 10% decline in 2024 through the first three quarters of the year. Compared to the official Rosstat figures, these numbers seem more plausible for a country that is engaged in a protracted war, burdened by heavy regulation and corruption, cut off from feedback channels between the government and the people, drifting toward isolation, and reliant on authoritarian neighbors.
Money supply, or monetary aggregate M2, is the sum of cash in circulation outside the banking system plus the money available to holders of bank accounts.
Nominal GDP: in the first year 1000*1+100*10=1000+1000=2000, in the second year 1000*1.2+105*10=1200+1050=2250. That is, an increase of 250 tugriks or 12.5%.
To use the deflator, it is necessary to determine the specific weights of all goods. The share of bread loaves is 1200 out of 2250, that is, 53.3%. The share of televisions is 1050 out of 2250, that is, 46.7%.
Taking these weights into account, bread loaf production did not grow, while television production grew by 5%. Therefore, the weighted average production growth will equal the product of 0.05 and 0.467, that is, 2.335%.
1,1*1,15*1,03*1,12=1,46
For 2024, GDP amounted to 201 trillion against 108 trillion in 2020, that is, it grew by a factor of 1.86, not exactly by a factor of two.
Based on Romir’s inflation data, Russia’s economy shrank by 19% in 2022, and was on pace for an additional 10% decline in 2024 through the first three quarters of the year
There are three strong arguments supporting the view that prices are rising faster than official figures suggest — and that real incomes are not growing, but shrinking. First, it is quite strange to accept inflation rates around 7–10% when the money supply is growing at a rate of roughly 20% annually (19.2% in both 2023 and 2024, and 24.4% in 2022). Such a situation is possible only if the velocity of money circulation drops sharply — that is, if economic agents increase their demand for money and choose to hold larger cash balances.
But money velocity rarely shows sharp fluctuations, and such a trend is not visible in the Russian economy. The moderately rising share of cashless payments does not explain the trend — they accounted for 78% of transactions in 2022, 83% in 2023, and 86% in 2024, and their numbers were not synchronized with the pace of money issuance. Therefore, inflation estimates based on Romir’s data seem much more plausible: about 33% in 2022, roughly 16% in 2023, and around 22% in 2024.
Moreover, the official inflation narrative requires believing in an unprecedented rise in real interest rates — not just nominal ones. The increase in nominal rates is clear: currently, banks issue short-term loans to individuals at an average of 29.2%, with loans of 1–3 months carrying rates as high as 43.1% per year. Four years ago, these rates stood at 13.6% and 14.8%, respectively.
If Russians had truly grown wealthier during the war years, as official sources claim, why would so many be borrowing at nominal rates of 20%, 25%, or even 30%? Even adjusted for inflation, these figures represent usurious real rates unprecedented in the Putin era. However, if we accept that inflation in 2024 was not 6–8%, but rather 21–23%, then the real interest rate on loans up to one year falls to a more plausible 6–9%, and for 1–3 month loans, the real rate is 20–21%. These rates are still high, but they are at least understandable in a situation in which peoples’ real incomes are shrinking.
Money supply, or monetary aggregate M2, is the sum of cash in circulation outside the banking system plus the money available to holders of bank accounts.
Nominal GDP: in the first year 1000*1+100*10=1000+1000=2000, in the second year 1000*1.2+105*10=1200+1050=2250. That is, an increase of 250 tugriks or 12.5%.
To use the deflator, it is necessary to determine the specific weights of all goods. The share of bread loaves is 1200 out of 2250, that is, 53.3%. The share of televisions is 1050 out of 2250, that is, 46.7%.
Taking these weights into account, bread loaf production did not grow, while television production grew by 5%. Therefore, the weighted average production growth will equal the product of 0.05 and 0.467, that is, 2.335%.
1,1*1,15*1,03*1,12=1,46
For 2024, GDP amounted to 201 trillion against 108 trillion in 2020, that is, it grew by a factor of 1.86, not exactly by a factor of two.
If Russians have truly grown wealthier during the war years, then why are so many of them borrowing at rates of 20%, 25%, or even 30%?
Finally, the rise in the share of cashless payments — that is, economic transactions visible to statisticians — indicates that the transparent, government-monitored sector of the economy has expanded, while the shadow economy has shrunk. This shift has contributed significantly to the «economic growth» reported by Rosstat. However, what’s really happening is less about growth and more about a structural shift taking place amid stagnation in overall economic volume.
For example, a provincial auto repair shop might have previously fixed three cars a week but officially reported only one; now it repairs just two cars, but payment for both is fully recorded in the statistics. The government can take pride in such signs of progress, but the wealth of the people under these conditions is not growing — it is declining.
That is why talk of recession by Reshetnikov and others did not sound unrealistic. The economic downturn in Russia has likely been in progress since February 2022. In 2023, the decline nearly halted — but only thanks to hopes inspired by the Central Bank, which kept the key interest rate below pre-war levels for a full year starting from July 2022, flooding the economy with cheap money.
This could only end in a bitter hangover — one which arrived in 2024, when it became clear that Russia needed a “cooling,” a “slowdown,” a “soft landing” — or, in direct language, Russia urgently needs to wean itself off the monetary stimulus. The real decline has occurred, is occurring, and will continue to occur. The only questions are to what extent inflation will accompany the downturn, whether the recession can be masked in official statistics, and who will be held responsible for the parlous state of the Russian economy?
Money supply, or monetary aggregate M2, is the sum of cash in circulation outside the banking system plus the money available to holders of bank accounts.
Nominal GDP: in the first year 1000*1+100*10=1000+1000=2000, in the second year 1000*1.2+105*10=1200+1050=2250. That is, an increase of 250 tugriks or 12.5%.
To use the deflator, it is necessary to determine the specific weights of all goods. The share of bread loaves is 1200 out of 2250, that is, 53.3%. The share of televisions is 1050 out of 2250, that is, 46.7%.
Taking these weights into account, bread loaf production did not grow, while television production grew by 5%. Therefore, the weighted average production growth will equal the product of 0.05 and 0.467, that is, 2.335%.
1,1*1,15*1,03*1,12=1,46
For 2024, GDP amounted to 201 trillion against 108 trillion in 2020, that is, it grew by a factor of 1.86, not exactly by a factor of two.